

Deciding Suitability of Empirical formulas for Hydraulic calculations
In calculating discharge with Inglis/Dickens formulas the Constant values are given irrespective of terrain characteristics which literally means that the velocity or discharge is not affected by the terrain. This is quite unexpected, hence the constant values must differ as per catchment area slope. Steeper the slope of catchment lesser the time of concentration hence higher the constant value.
Earlier graphs showing the relation between the slope of catchment and coefficient for empirical formula were given but recently this method is not used by anybody resulting in calculations, which have no consideration for catchment slope.
Can velocity of water flow through river in region shown below 2 images can match?


R.D.S.O. have developed some charts showing runoff from catchment areas.
Steps to calculate Discharge is as follows
Step 1) From map Estimate 2 year 1 hour rainfall intensity from Map

For Akola area its 2 years 1 hour Rainfall is 2.4
Step 2) Search Catchment area zone on map
From Map it is seen that catchment area lies in zone number II
Step 3) From map Estimate multiplying factor for 50 year 1 hour rainfall intensity
| Ratio of n Year 1 hour rainfall to 2 year 1 hour rainfall | |||||||
| Zone | 5 | 10 | 20 | 25 | 30 | 40 | 50 |
| I | 1.2 | 1.38 | 1.54 | 1.62 | 1.65 | 1.73 | 1.85 |
| II | 1.26 | 1.46 | 1.74 | 1.84 | 1.9 | 2.04 | 2.17 |
| III | 1.31 | 1.6 | 2.03 | 2.14 | 2.27 | 2.52 | 2.64 |
| IV | 1.19 | 1.32 | 1.52 | 1.58 | 1.61 | 1.72 | 1.79 |
From Table Multiplying factor for getting ' 50 year' 1 hour rainfall is 1.85
Therefor '50 years, 1 hour rainfall over the catchment = 2.4 x 2.1 = 5.04
Step 4) Calculate Statistical slope of catchment area.
Statistical slope = ∑(Li Hi)/A
L = Length of successive contours from the boundary of catchment area to the other in miles to be measured on toposheets.
H = Catchment area in sq.miles
| SR.No. | Value of Contour (ft) | Length pf contour lines (miles) |
| L1 | 1000 | 4.8 |
| L2 | 1050 | 6.8 |
| L3 | 1100 | 6.6 |
| L4 | 1150 | 6.2 |
| L5 | 1200 | 6 |
| L6 | 1250 | 7.4 |
| L7 | 1300 | 9.1 |
| L8 | 1350 | 9.5 |
| L9 | 1400 | 10.1 |
| L10 | 1450 | 9.6 |
| L11 | 1500 | 9 |
| L12 | 1550 | 10 |
| L13 | 1600 | 10.2 |
| L14 | 1650 | 9.8 |
| L15 | 1700 | 3 |
| L16 | 1750 | 1.8 |
| L17 | 1800 | 1.9 |
| L18 | 1850 | 1.7 |
| L19 | 1900 | 1.2 |
| L20 | 1950 | 0.5 |
| L21 | 2000 | 0.3 |
∑ Li = 125.5 miles
h X ∑ Li = 125.5 X 50 = 6275
(h X ∑ Li)/2 = 6275/2 = 3137.5
(h X ∑ Li)/2A = 3137.5/21 = 149.404 ft/mile
Now 5280 ft = 1 mile
hence % slope of catchment = 149.404 X 100 / 52.80 = 2.83 %
Step 5) Obtain Value of 'K' from Graph
| Table showing 'K' values for different rainfalls and statistical slopes | |||||
| 50 Year 1 hour rainfall | Hilly slope 10% and above | Rough hilly 5% - 10% | Rolling 2% - 5% | Flat to Rolling 1.2% | Flat to Rolling 0.1% |
| 2.5 | - | - | 0.8 | 0.3 | 0.15 |
| 3 | 0.92 | 0.9 | 0.85 | 0.5 | 0.2 |
| 3.5 | 0.93 | 0.92 | 0.9 | 0.6 | 0.25 |
| 4 | 0.95 | 0.94 | 0.92 | 0.7 | 0.3 |
| 4.8 | 1.1 | 0.96 | 0.95 | 0.9 | 0.35 |
| 5 | 1.2 | 1.06 | 1 | 0.95 | 0.4 |
| 5.5 | 1.3 | 1.28 | 1.1 | 1 | - |
| 6 | 1.3 | 1.32 | 1.15 | - | - |
| 6.5 | 1.34 | - | - | - | - |
For Rainfall intensity = 5.04 and Catchment slope = 2.83, K = 1.1
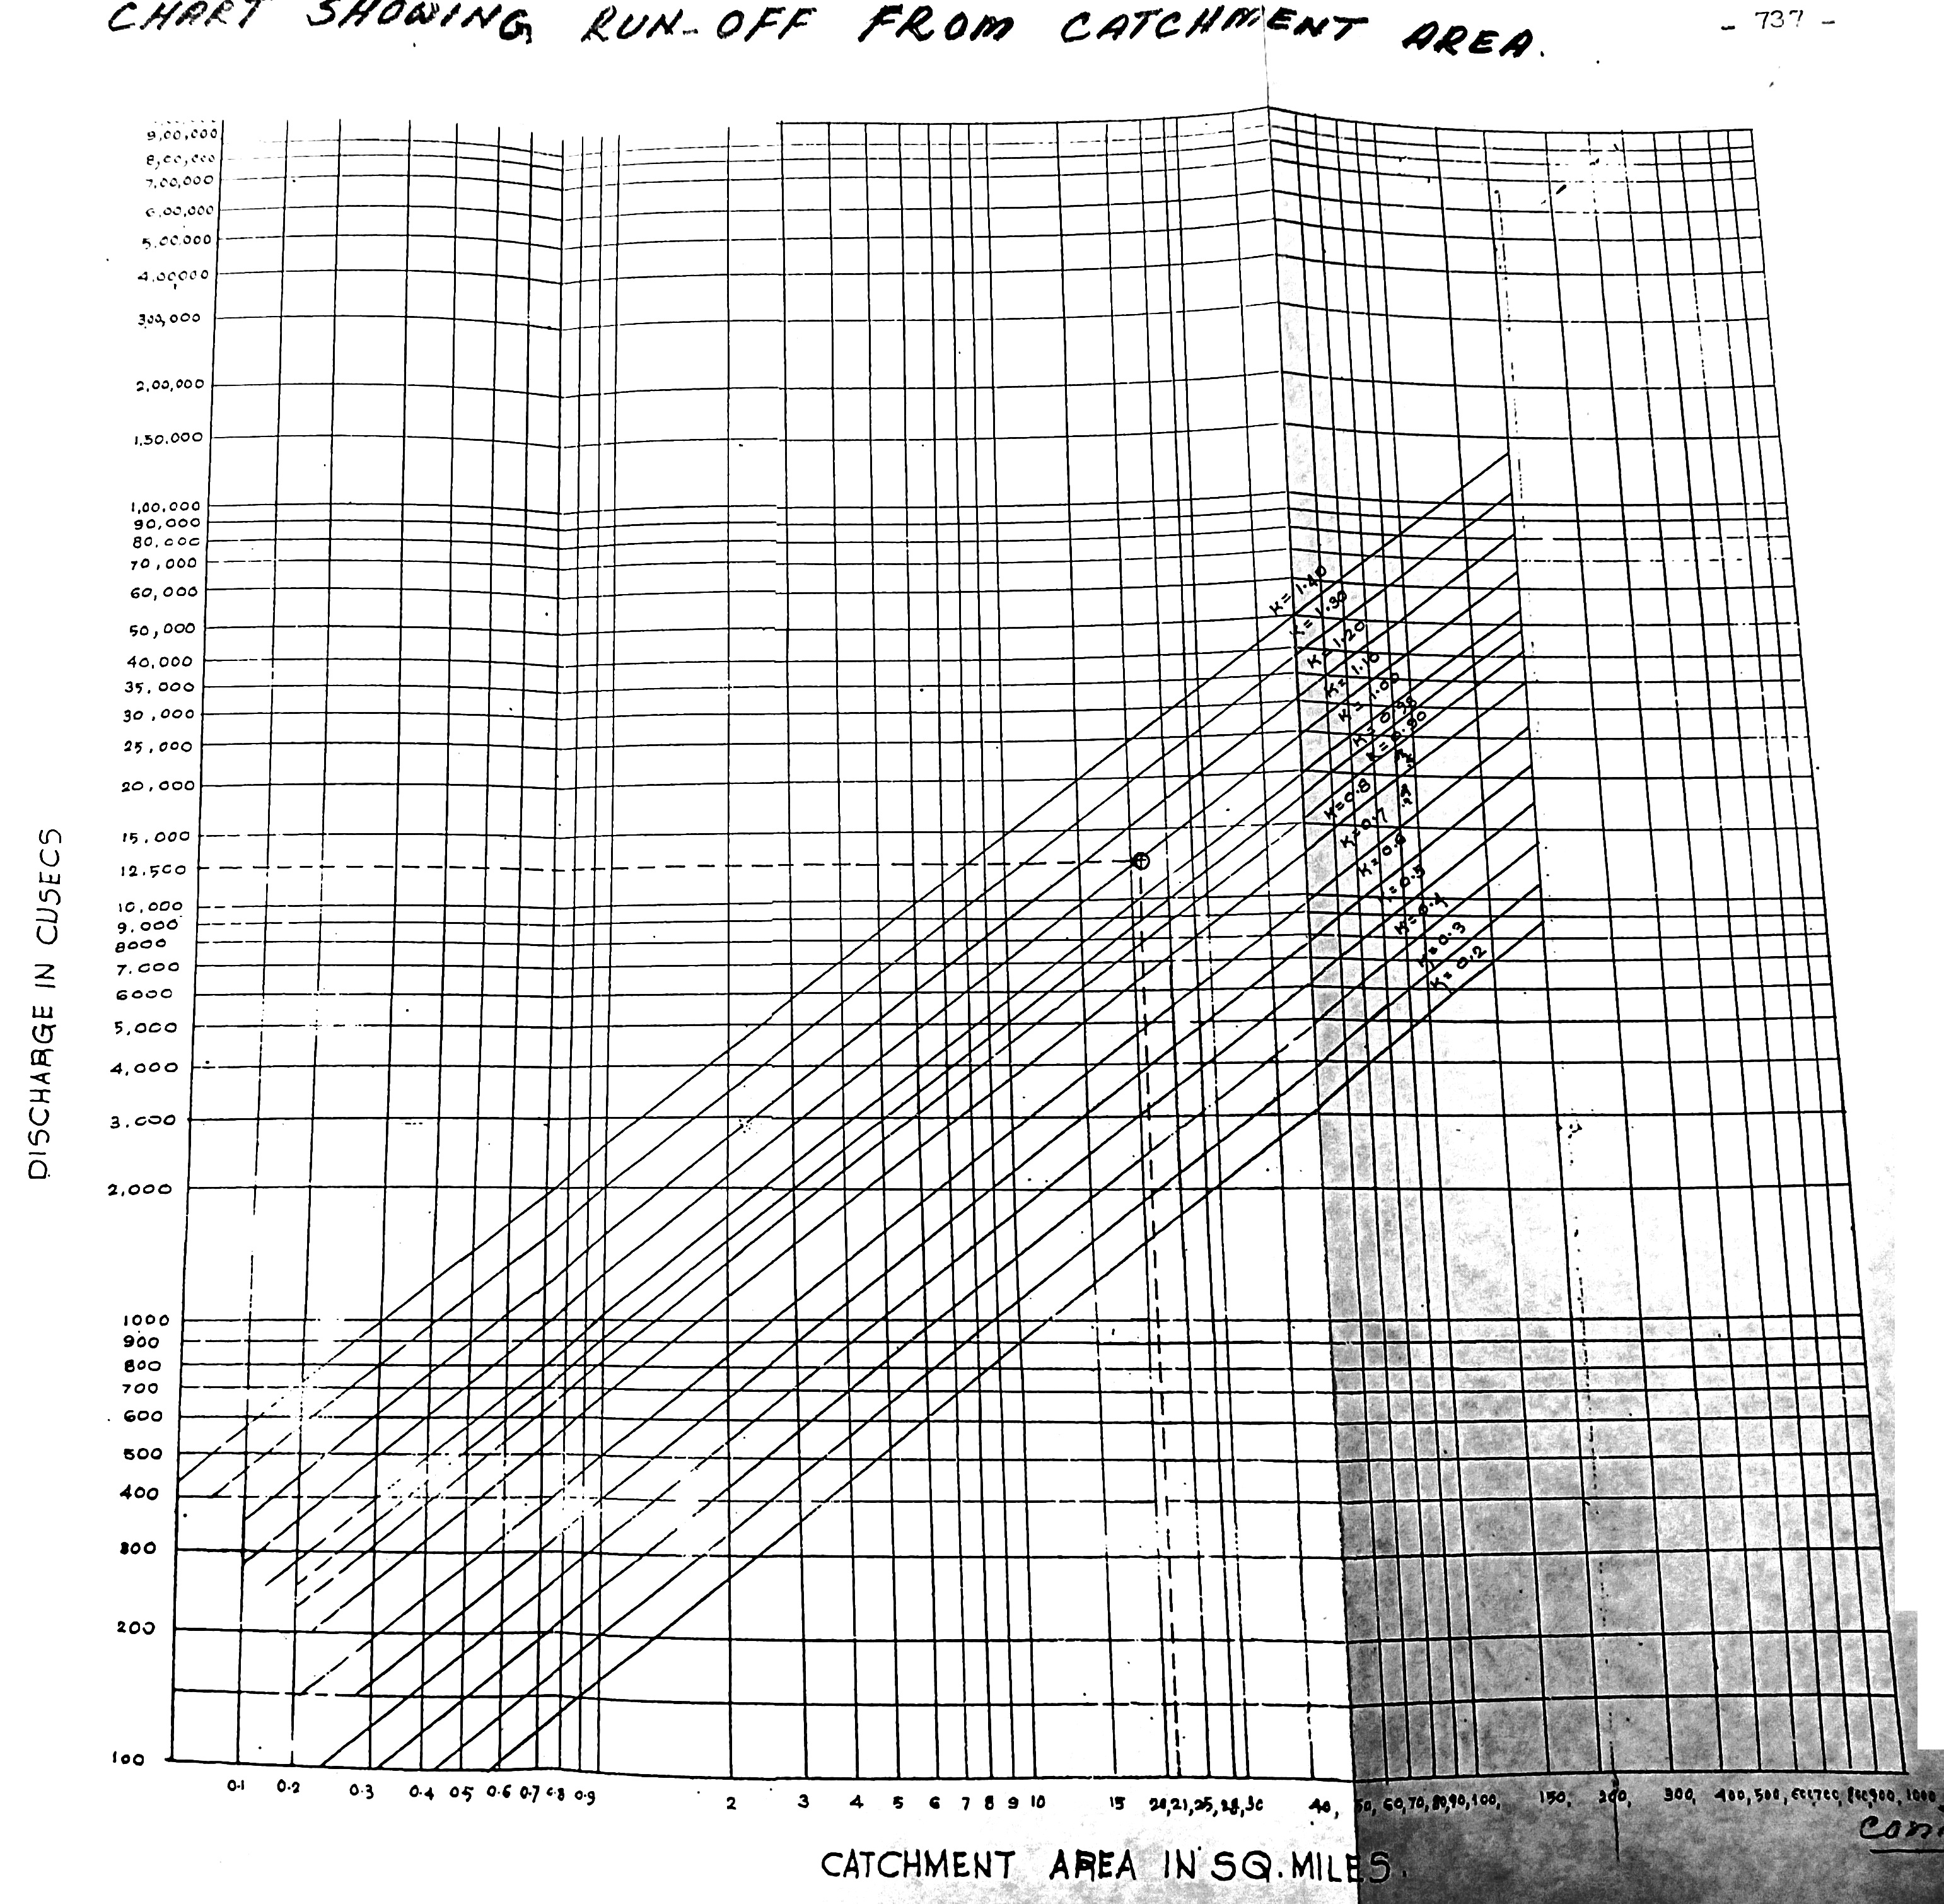
Step 6) Calculate Discharge from catchment area
catchment area = 21 sq.miles for K = 0.91
Discharge = 12500 cusecs
Inglis Discharge = 29400 cusecs
Modified Inglis = 16000 cusecs
From Following graph Dickens constant C = 1300 hence
Dickens Discharge = 12740 Cusecs

Hence Most suitable formula for area under consideration is Dickens formula.


0 Comments
If you have any doubts, suggestions , corrections etc. let me know